PulsarOps AI Book a demo
Case study

AI-powered network observability for a major telecommunications provider

A North American carrier rebuilt its network operations with MIR Digital Solutions on the PulsarOps AI event intelligence platform.

At a glance

Sector
Telecommunications
Region
North America
Delivered by
MIR Digital Solutions
Platform
PulsarOps AI

We do not name the provider. We describe deployments only as enterprise NOCs worldwide.

Context

A national network, and a triage workflow that stopped scaling with it.

Events arrive from every corner of the infrastructure, across vendors that do not agree on a log format. The provider wanted that work changed, not another console.
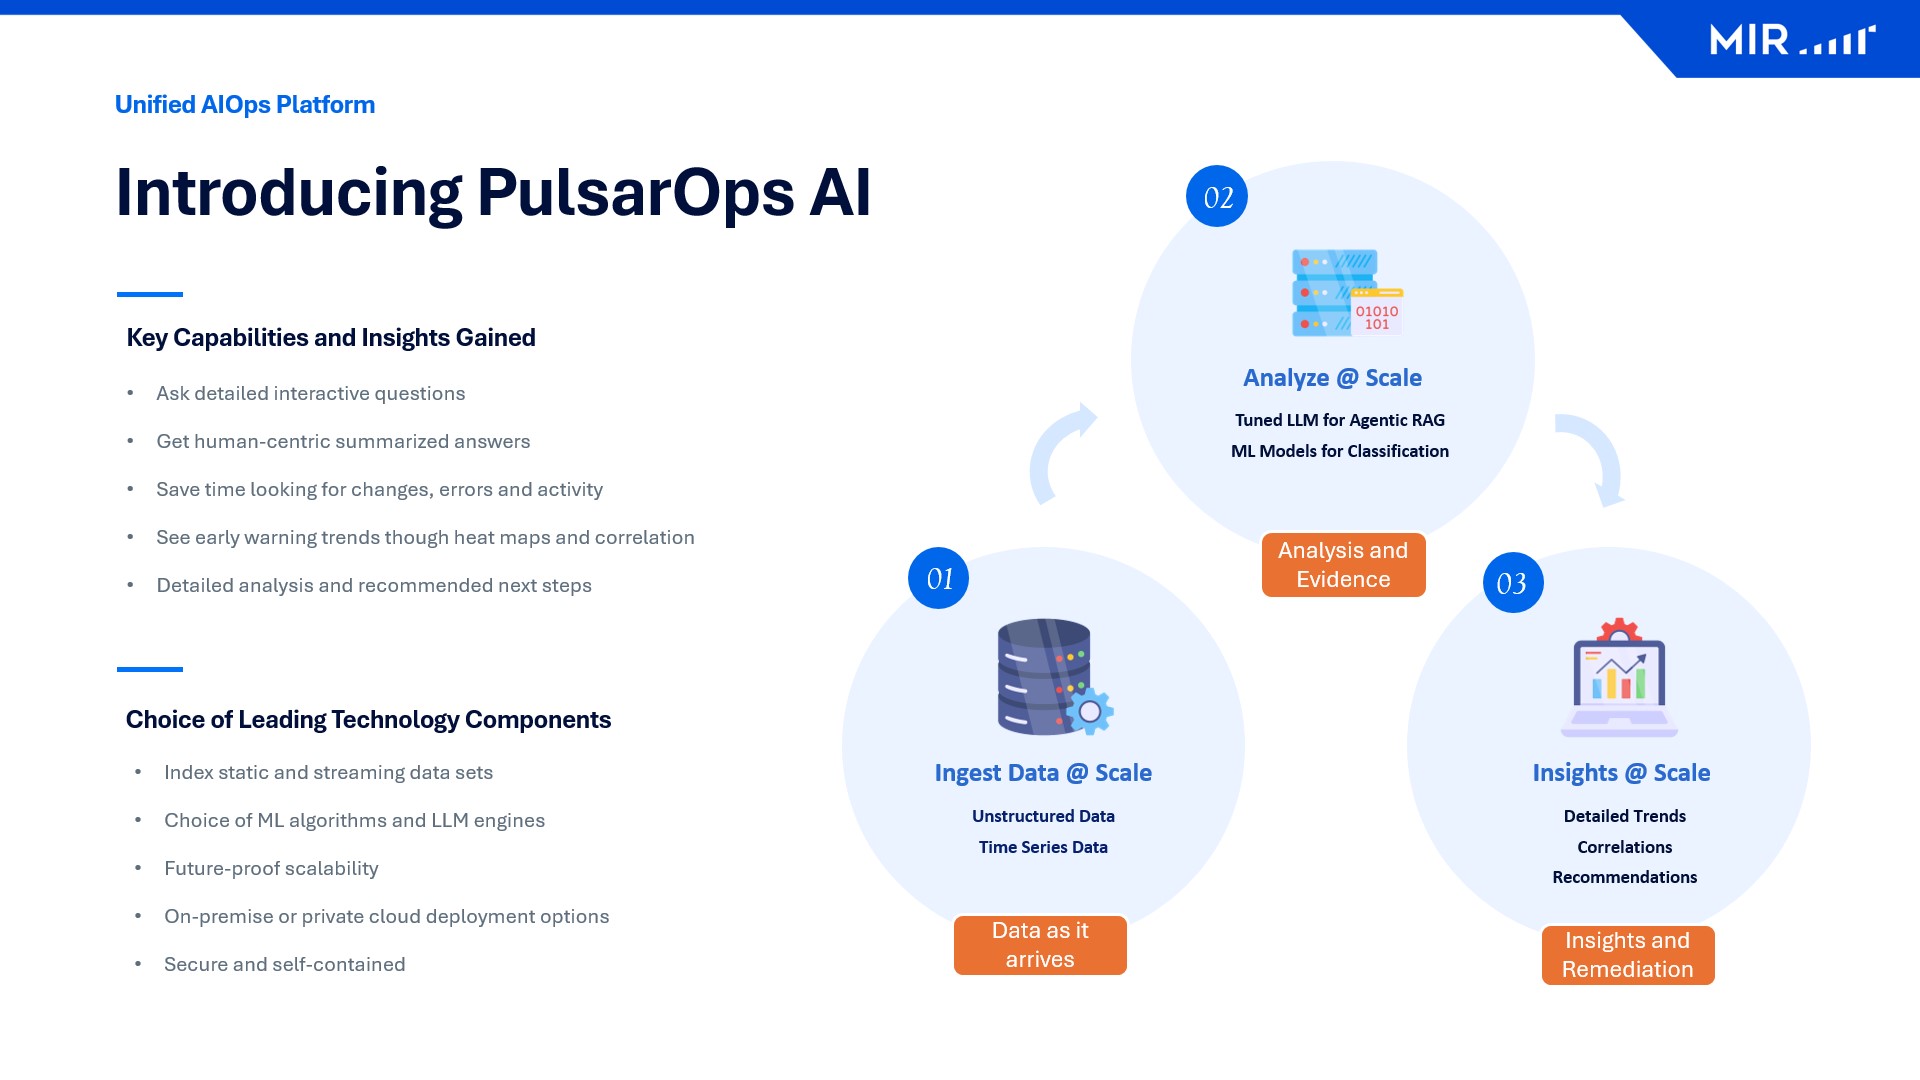
The three platform stages, ingest, analyze and insights, with the components behind each one
The challenge

Three problems. None of them was a shortage of data.

The signal was already in the logs.

Fragmented troubleshooting

Evidence for one incident sat in several consoles, so every investigation started by hand.

A multi-vendor infrastructure

Routers, switches, firewalls and load balancers, each with its own log format.

Reactive vulnerability management

Security awareness arrived after the event, never ahead of it.

One incident, split across two consoles

Core router Aggregation A one incident timeline

  • link state down
  • interface flap
  • bgp session reset
  • mac move detected
  • protocol down
  • uplink error rate

Two device timelines zip into one order.

What the platform did

One platform for correlation, visibility and security awareness.

It runs alongside the monitoring the NOC already had.
01 · Intelligent insights

Automated event correlation across the infrastructure

  • Correlate events across multi-vendor infrastructure.
  • Surface what matters before someone goes looking.
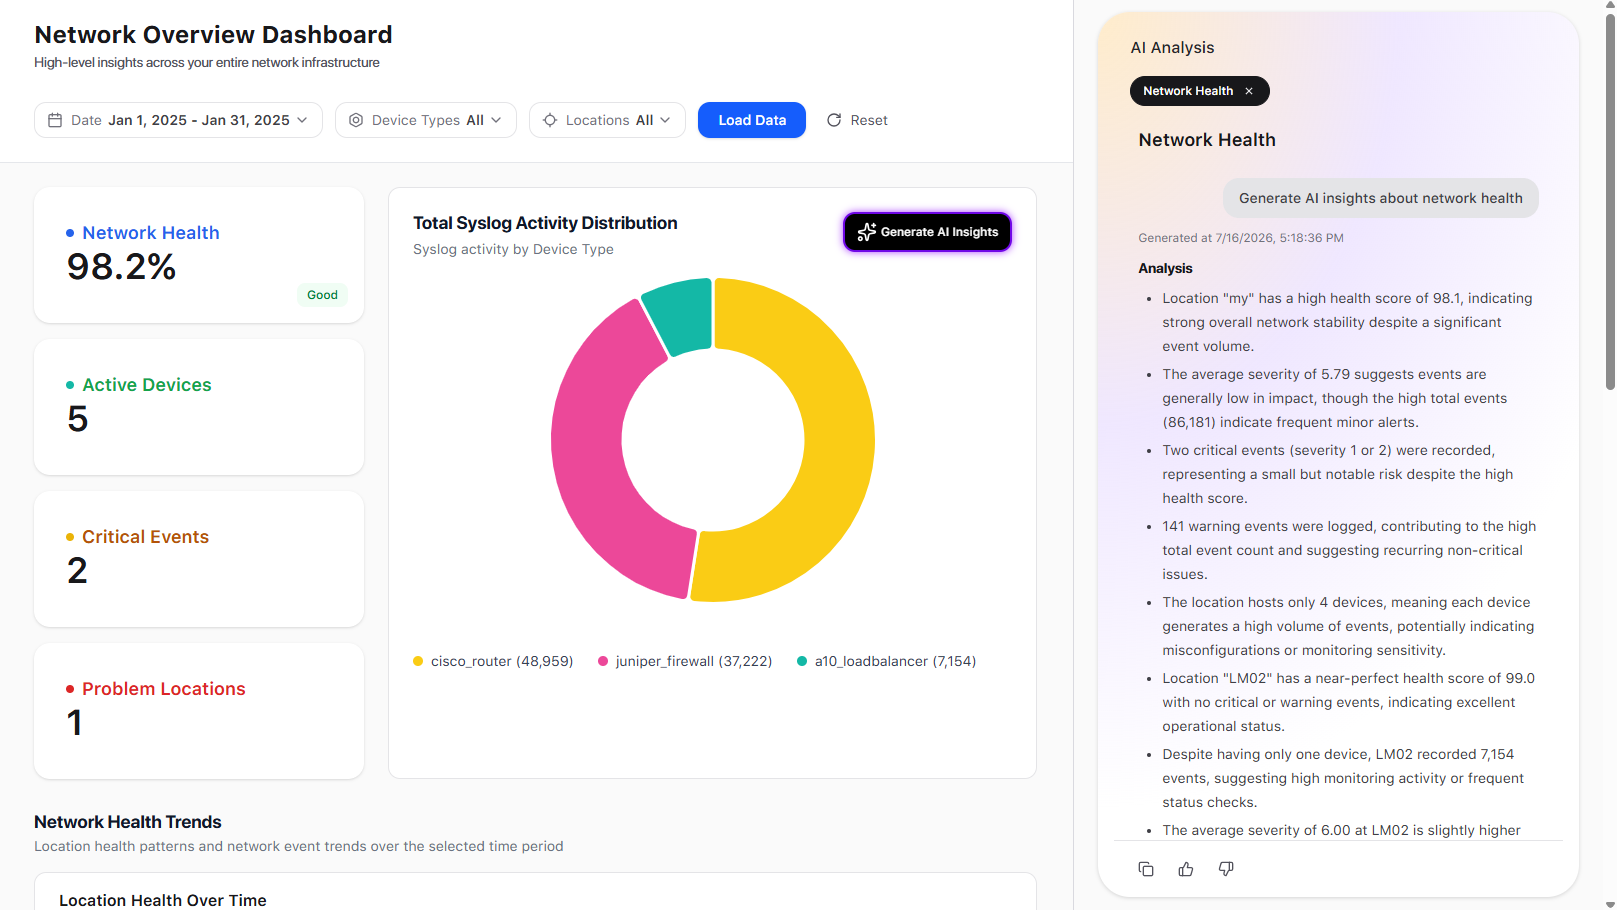
Network overview
PulsarOps AI network overview dashboard listing devices, interface error counts and correlated event groups.
Platform view. No customer data shown.
02 · Conversational troubleshooting

Ask the network a question in plain language

  • Query event logs, configurations and topology in plain language.
  • Get a written summary with the evidence behind it.
  • Get the recommended next step.
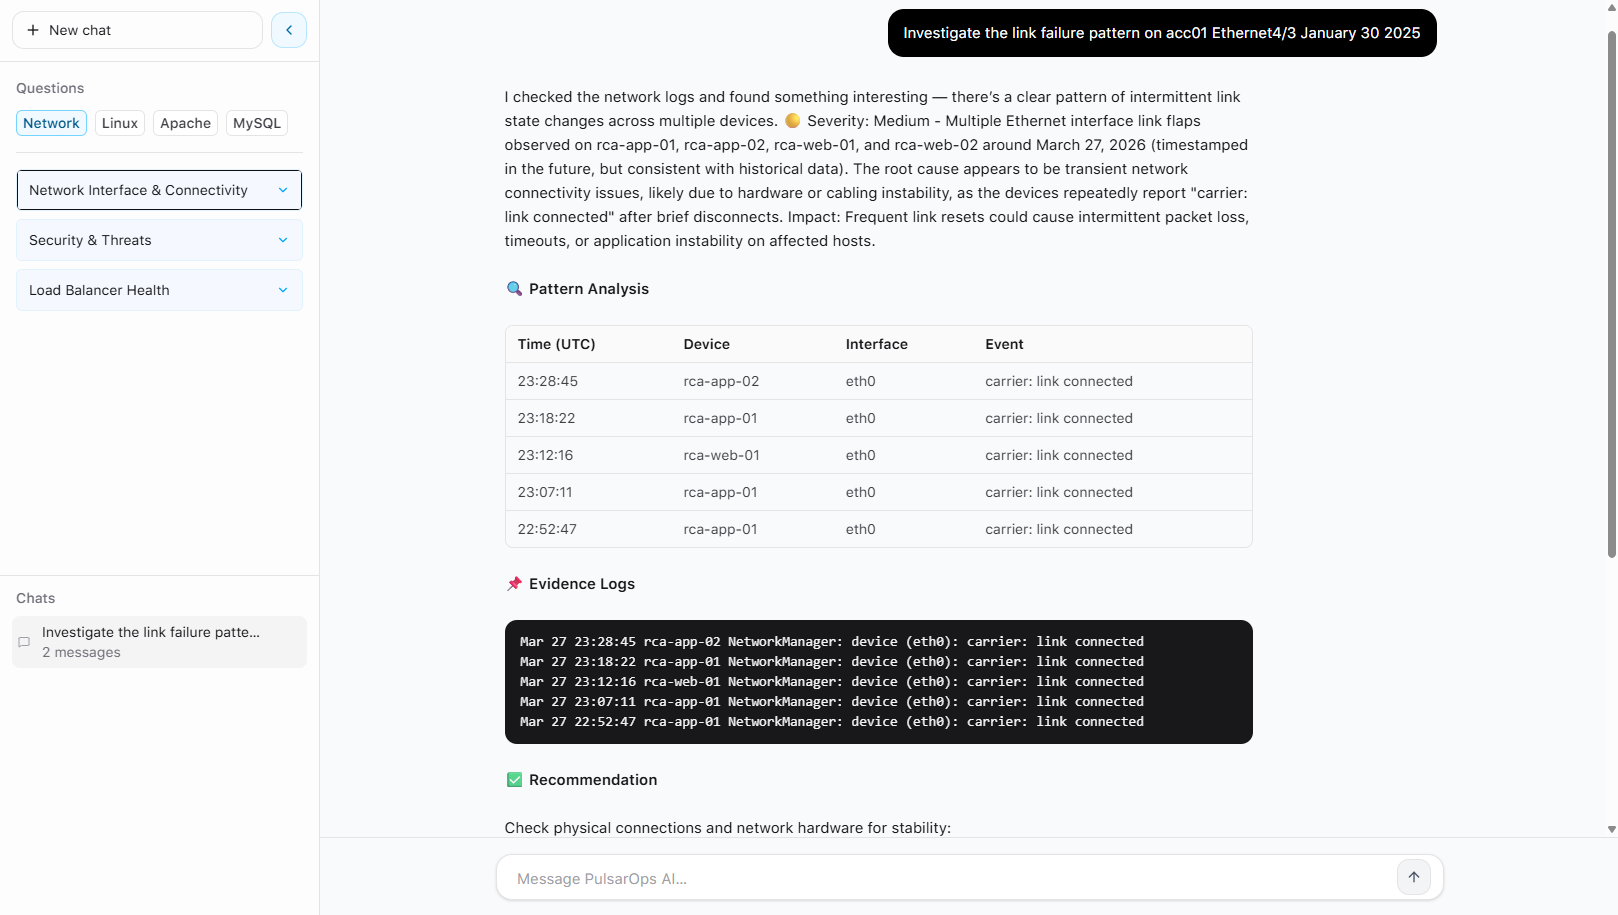
AI assistant
PulsarOps AI assistant panel answering a network health question with a written summary and supporting log evidence.
Platform view. No customer data shown.
03 · Proactive vulnerability intelligence

Security awareness that arrives before the incident

  • Network and security signals in one view instead of two.
  • Vulnerability intelligence that runs ahead of the event.
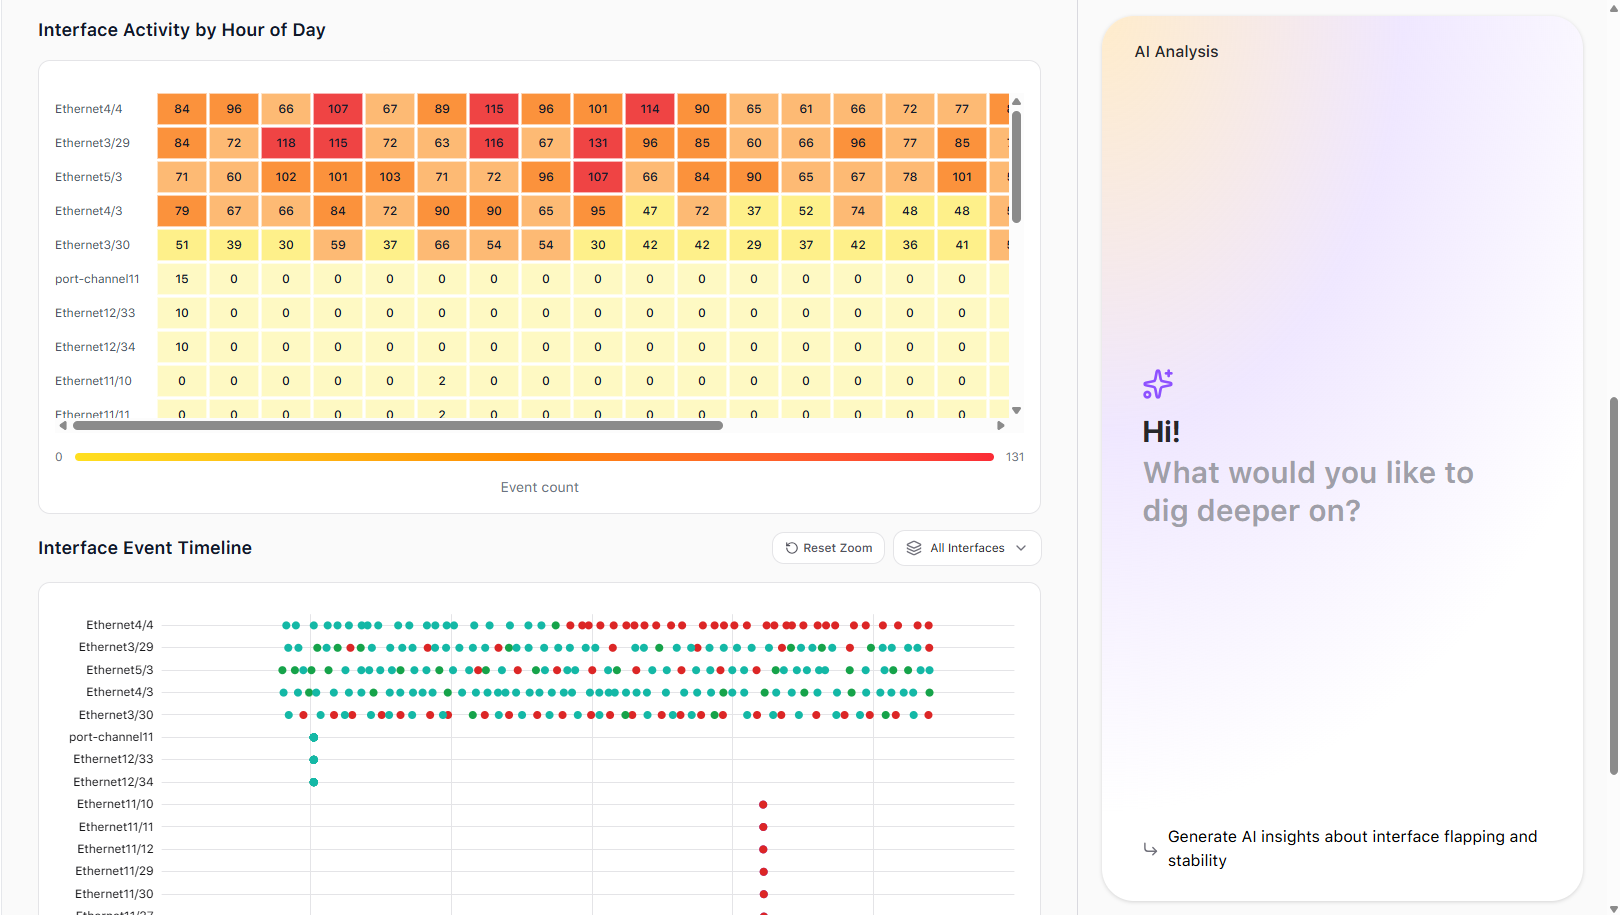
Interface analysis
PulsarOps AI interface analysis view charting error and discard trends per interface over time.
Platform view. No customer data shown.
The outcome

What changed for the team.

Four things the provider reports in the published study.

01

Improved operational efficiency

Same team, same infrastructure, correlation handled for them.

02

Reduced manual effort

Fewer hours assembling the picture, more spent acting on it.

03

Accelerated issue resolution

Investigations start from a grouped incident and a next step.

04

More proactive management

Early warning and vulnerability intelligence beside the events.

From the published case study, 5 August 2026. No deployment figures are claimed here. Contact sales@pulsarops.ai.

The business case

What a deployment of this shape is modeled to return.

Model figures from the CTO value brief, not from this provider.

Request the CTO value brief

An eight hour triage starts with finding the window

One day of data 13:58 – 14:06

fault window
  • 00:00
  • 06:00
  • 12:00
  • 18:00
  • 24:00

A day of data, one narrow fault window.

Incident recovery
50-75%
faster incident recovery
Return on investment
228%
annualized ROI
Payback
3.7 mo
payback period
Cost efficiency
2-4x
more cost-efficient over three years

Three-year estimate: five-person NetOps team, ~125 incidents/yr, triage cut from 8 hours to 1.

How it works

One platform. Three stages.

The same pipeline sits behind every deployment.

  1. 01 Ingest @ scale

    Data as it arrives

    • Syslogs and application logs
    • Configs and inventory
    • Tickets and topology

    Real-time and historical, multi-vendor

  2. 02 Analyze @ scale

    Analysis and evidence

    • Latest LLMs, agentic RAG
    • ML classification and anomaly detection
    • Pattern-based correlation

    Millions of events, minutes not hours

  3. 03 Insights @ scale

    Insights and remediation

    • Early warning trends
    • Root cause analysis
    • Recommended next steps

    Human-centric, evidence-backed

On-premise

Runs inside your perimeter. Nothing leaves your network.

Sovereign-ready

In-country deployment for government and regulated industries.

Cloud-agnostic

Your VPC on AWS, Azure, or GCP. Your keys, your controls.

See the full platform

Book a demo

See PulsarOps AI running on your own data.

Thirty minutes with an engineer. Bring a real incident.