
Multi-vendor streaming ingestion
Syslogs, application logs, configs, inventory, tickets and topology, in real time, from every vendor.
One pipeline for every vendor in your infrastructure, and every answer carries the evidence that produced it.
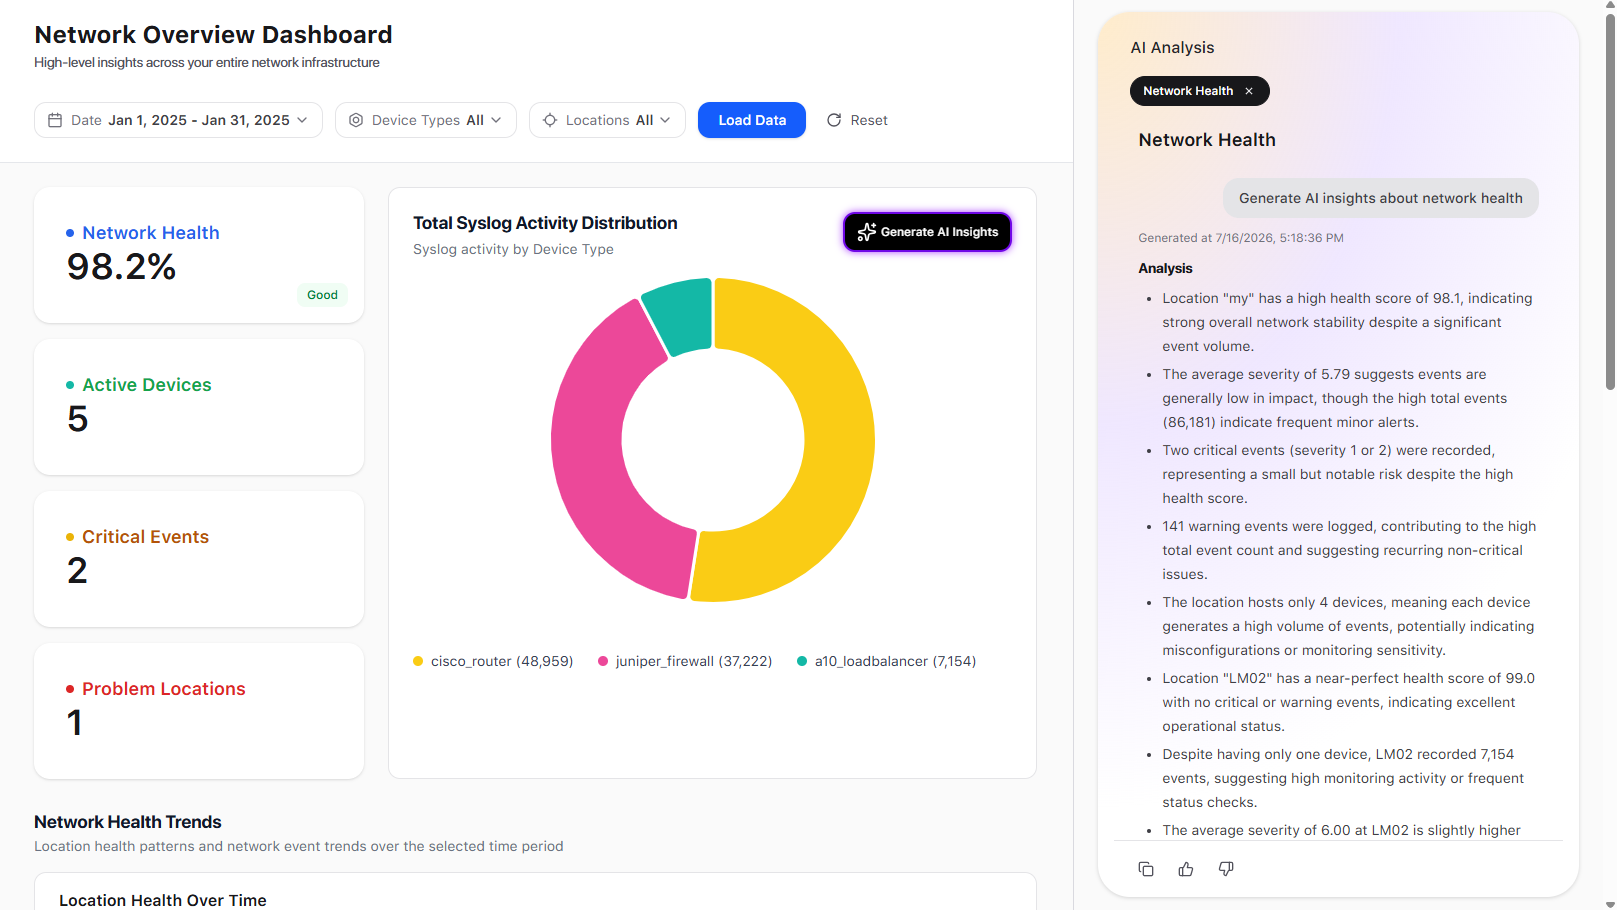
Four steps on one console, with the correlation already done.
The shift starts and nothing is down. No page overnight, every dashboard on the wall green, and a port flapping since the small hours.
It is not an outage yet. It is a rising count of interface errors on one link, buried in millions of syslogs from every vendor in the infrastructure. Monitoring tells you something broke. It does not tell you why.
1 Early warning
Nothing has breached a threshold yet
2 Drill down
One screen, no query language
3 Correlate
Pattern-based, ML-assisted
4 Act
Human-centric, evidence-backed
Six capabilities on one pipeline, which is why an answer carries its evidence.
Raw vendor output One schema
Five vendor formats, one aligned schema.
Syslogs, application logs, configs, inventory, tickets and topology, in real time, from every vendor.
Events connected across interfaces and devices, so one incident reads as one incident.
Ask in plain language. The retrieved logs, configs and topology come with the answer.
Millions of events sorted by type and frequency, so the shape of the problem shows first.
Degradation is visible while it is still a trend, before the ticket opens.
Every finding comes with a recommended action. Root cause is built in, not an add-on.
Data arrives, the analysis happens in the same place, and the insight leaves with its evidence.
One payload carried through all three stages.
01 Ingest @ scale
Real-time and historical, multi-vendor
02 Analyze @ scale
Millions of events, minutes not hours
03 Insights @ scale
Human-centric, evidence-backed
It names what enters each stage and what does the work.
Download the brief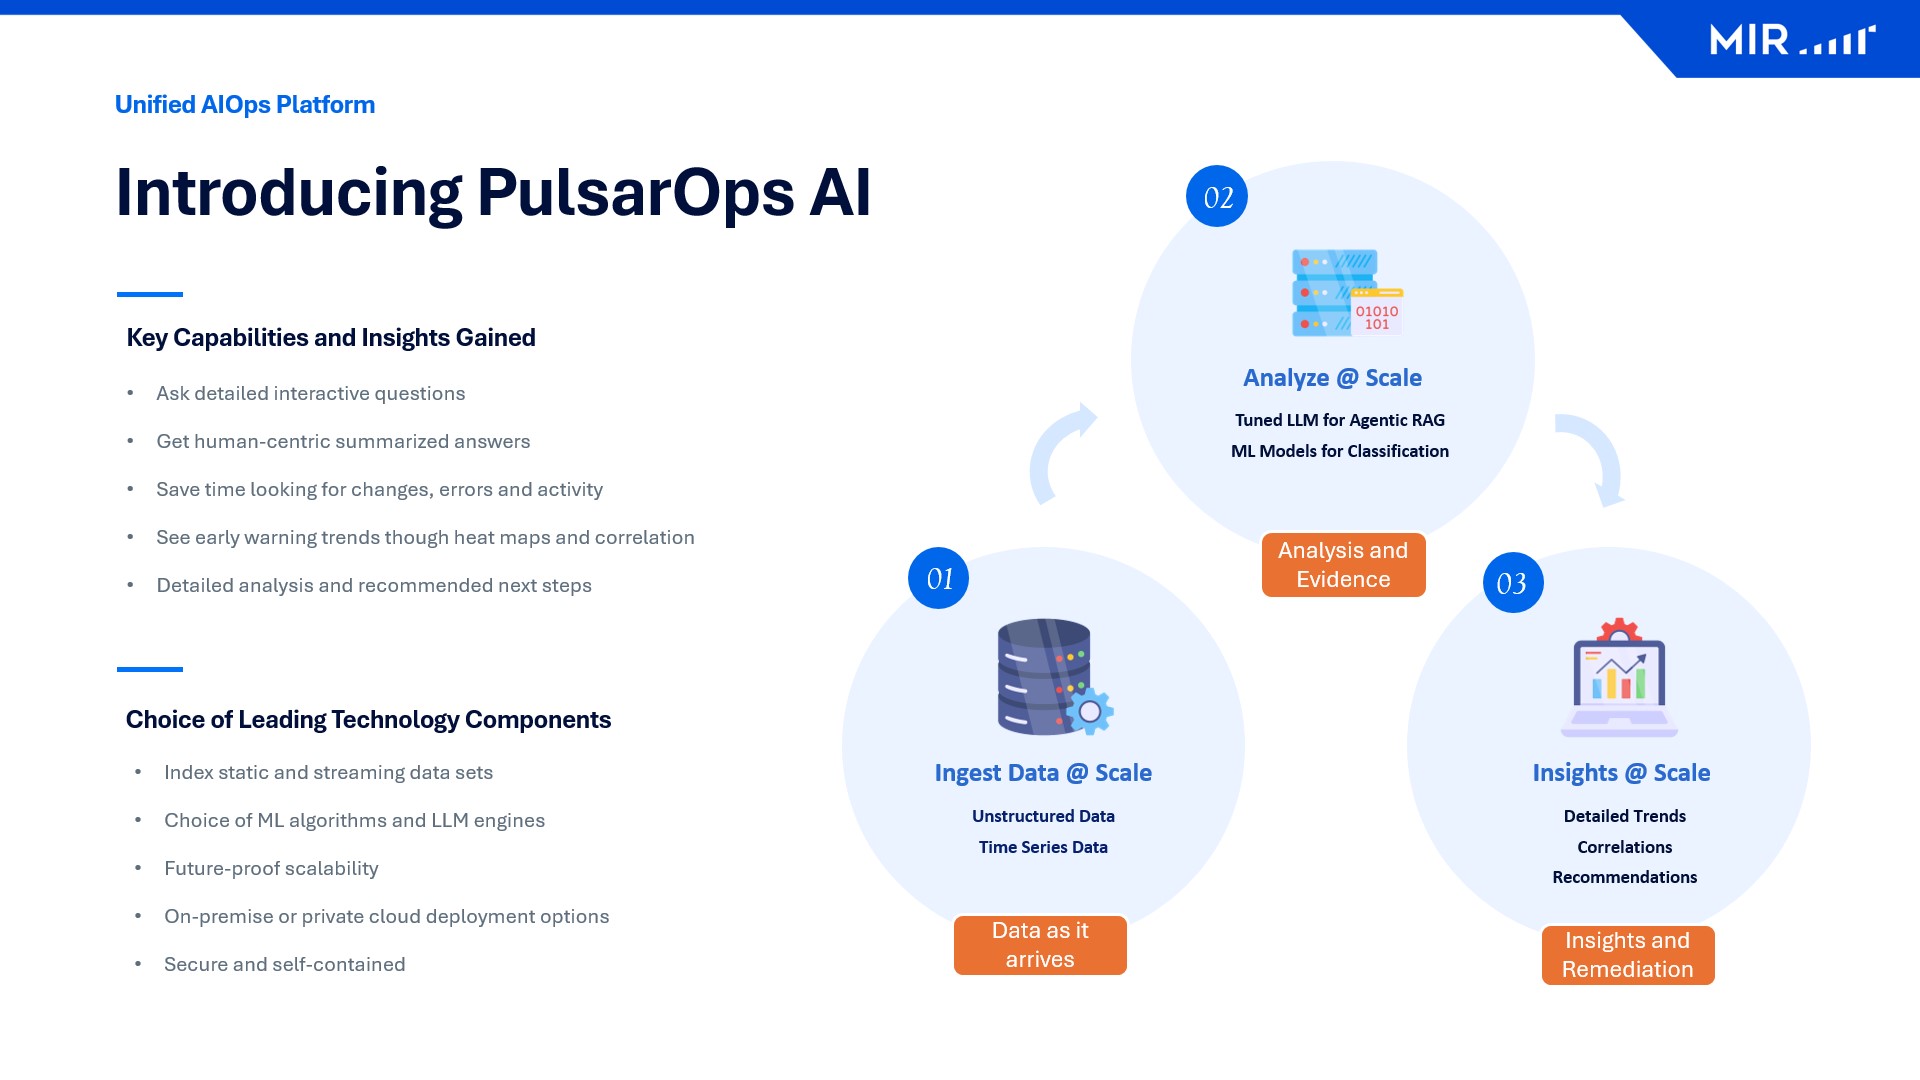
Written for the people who will run it.
01
Millions of real-time syslogs go in and troubleshooting starts, with no modeling exercise first.
02
Error logs are parsed into dashboards and the assistant, so the reading stops being a human job.
03
Trends and error classification make degradation visible while there is still time to act.
04
Engineers and sysadmins work in it at the same time, which matters on a bridge call.
05
The dashboards speed up the operations reporting your leads write by hand today.
06
ML picks out the related error logs.
Three-year estimate: five-person NetOps team, ~125 incidents/yr, triage cut from 8 hours to 1.
Step two of the port-flapping morning.
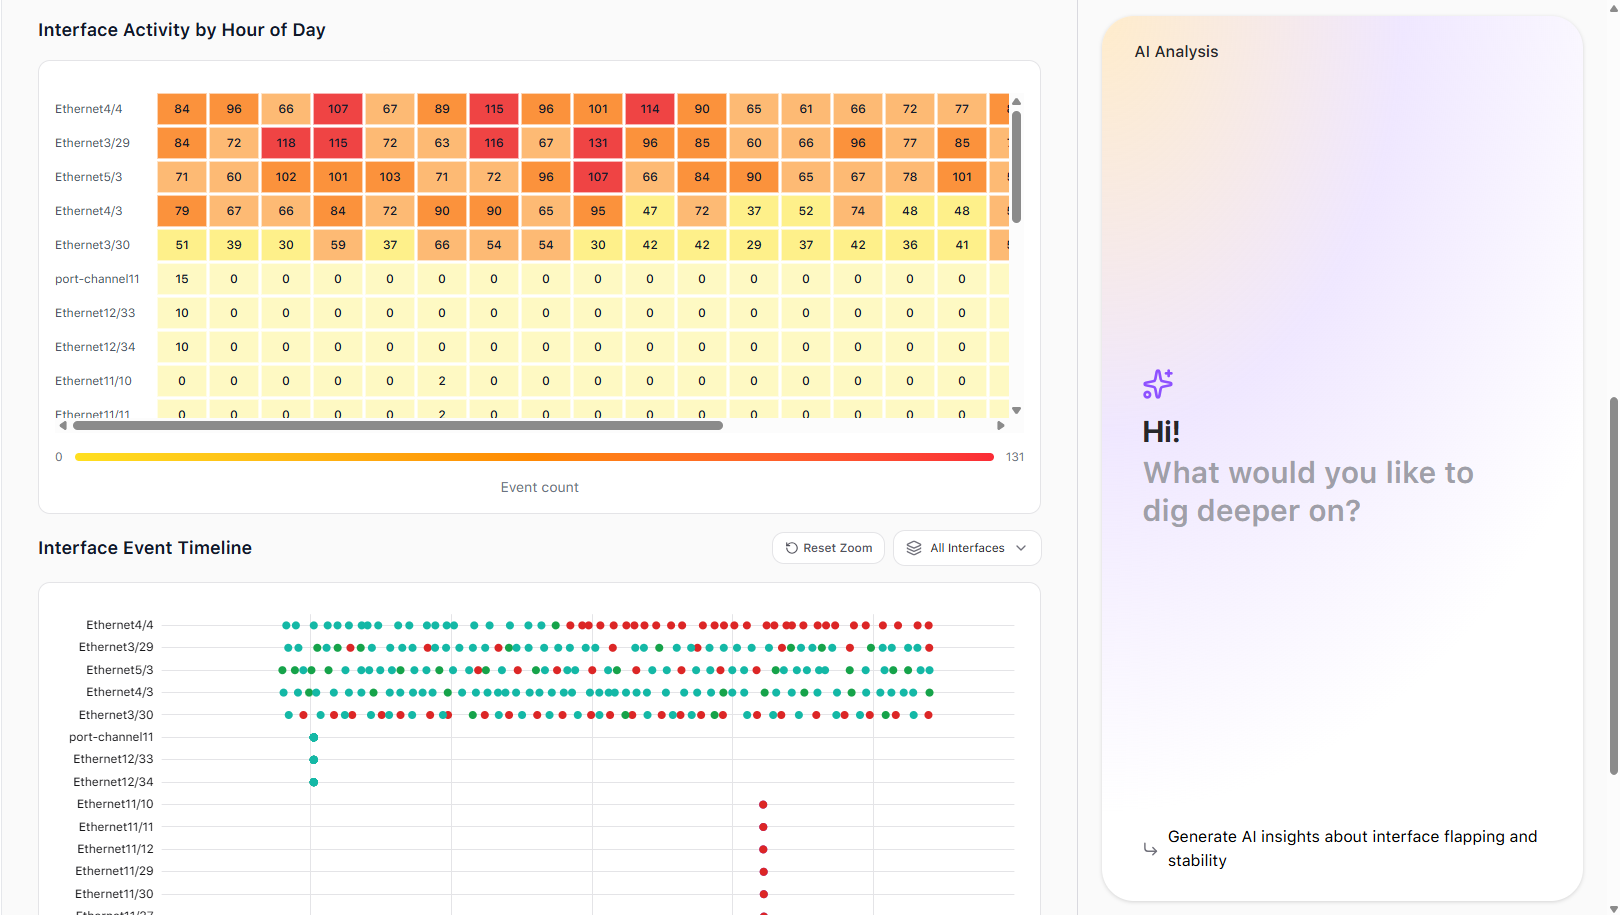
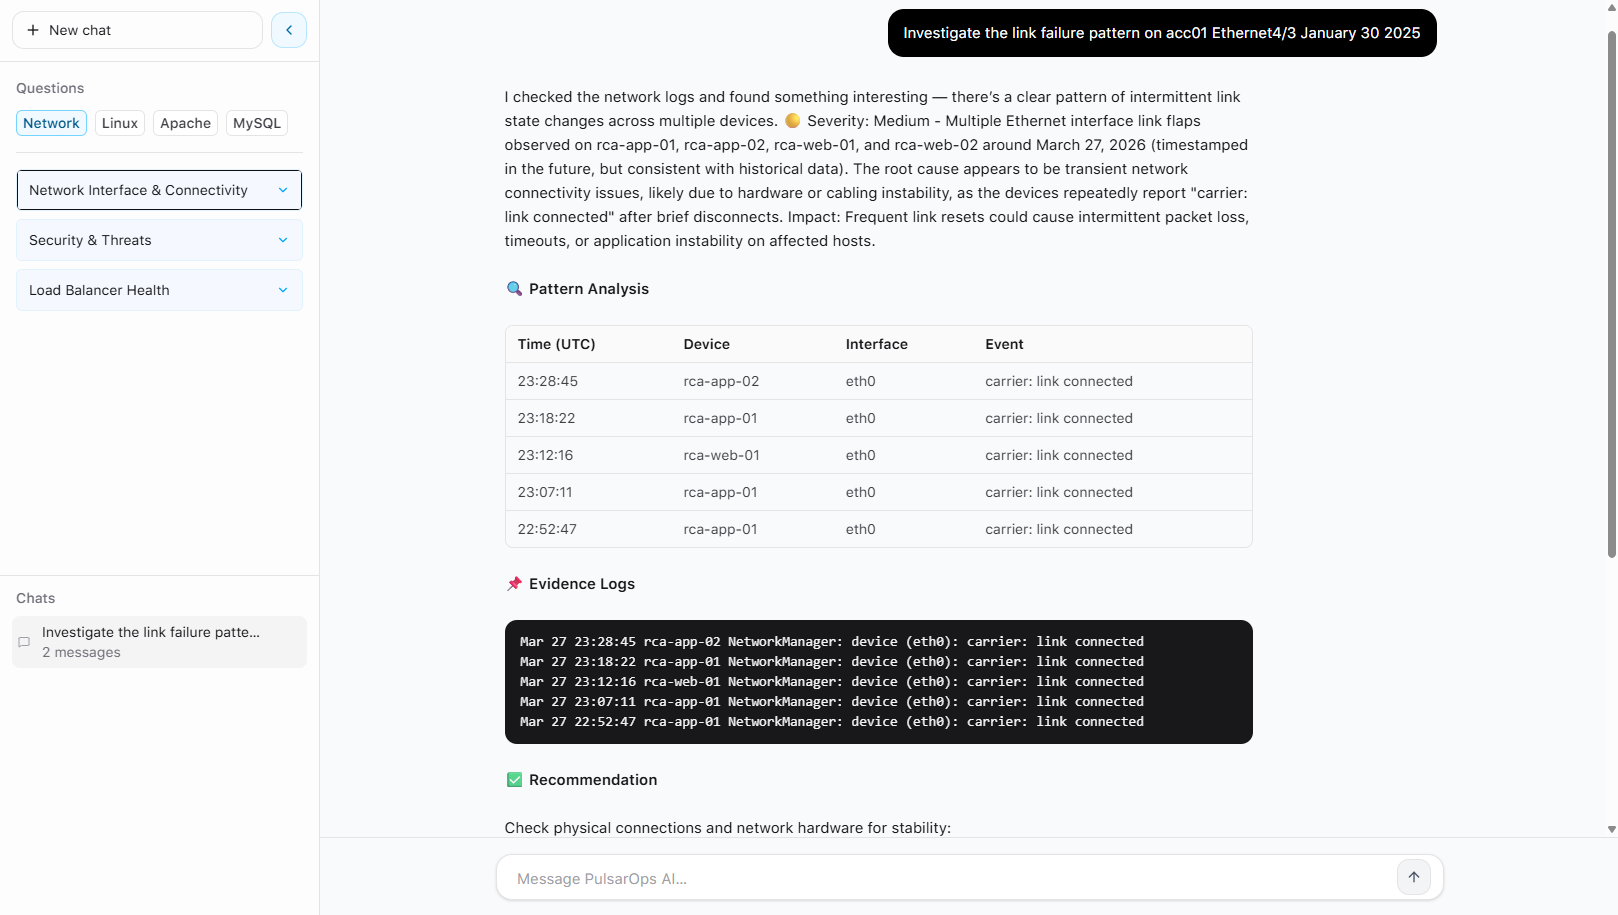
The events get connected and the cause gets named, with the evidence.
Scattered events snap into one related cluster.
The fault spreads down. The cause stays upstream.
fault on hop 3
The fault sits on one hop.
Regulated operators do not get to send network telemetry to someone else's tenant. So we never ask them to.
Read the security detailRuns inside your perimeter. Nothing leaves your network.
In-country deployment for government and regulated industries.
Your VPC on AWS, Azure or GCP. Your keys, your controls.
No. It runs alongside it and your alerts keep firing as they do today. The difference is the hour after the alert.
Nowhere. On-premise, sovereign-ready, or inside your own VPC on AWS, Azure or GCP. Only your data sources, your keys, your controls.
Multi-vendor and multi-protocol, with an adaptive device library behind it. The infrastructure it sits in run Cisco, Juniper, F5, Palo Alto, Nokia and Ericsson gear alongside Linux, Windows, MySQL and Apache.
Flat. Your bill tracks the size of your team, not your data volume, which is what makes it 2-4x more cost-efficient over three years. See the full comparison.
Three-year estimate: five-person NetOps team, ~125 incidents/yr, triage cut from 8 hours to 1.
Works with what you run
Categories, not vendor names.
| Capability | PulsarOps AI | Legacy log analytics | Monitoring suites | Cloud-only AIOps |
|---|---|---|---|---|
| Pricing model | Flat | Ingest-based | Per-device | Per-GB |
| Root cause | Built-in | Add-on | No | Partial |
| On-prem | Yes | Partial | Yes | No |
| Data sovereignty | Yes | Partial | Partial | No |
| AI assistant | Yes | No | No | Partial |
Scroll the table sideways on a narrow screen.
Thirty minutes with an engineer. Bring a real port-flapping morning.